
Financial transaction audio/visualisations
Interactive artwork series (etudes, ongoing development) that map time-sequenced change of multiple values (e.g. financial trading data) in sensorium-intensive real-time “audio-visualization” scenery.
Although there has been a range of historic and more recent examples of 3D visualization and ‘auditory displays’ of financial or stock data as efforts to enhance professional trading interfaces, this project tries to bridge extremes of unaesthetic usability and “sublime dysfunctionality” within aesthetic experience.
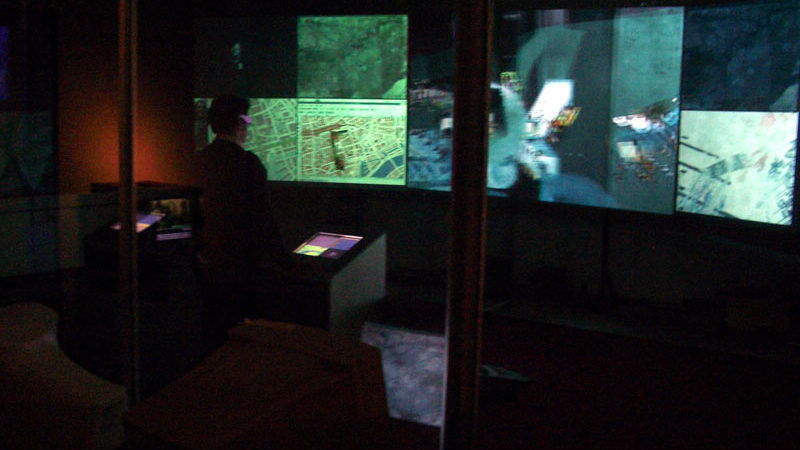
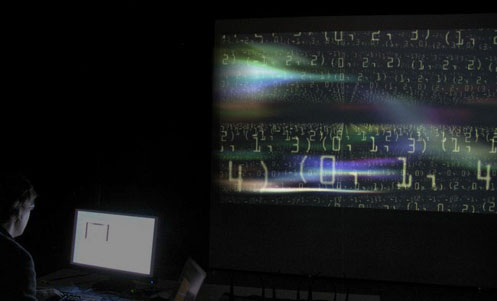
This experimental environment is intended as interactive VR/AR installation and/either audiovisual performance.
For the installation, the data acquisition modules feed from several sources of financial data (stock- and crypto-currency exchanges, aggregators, etc.) over their public Internet APIs.
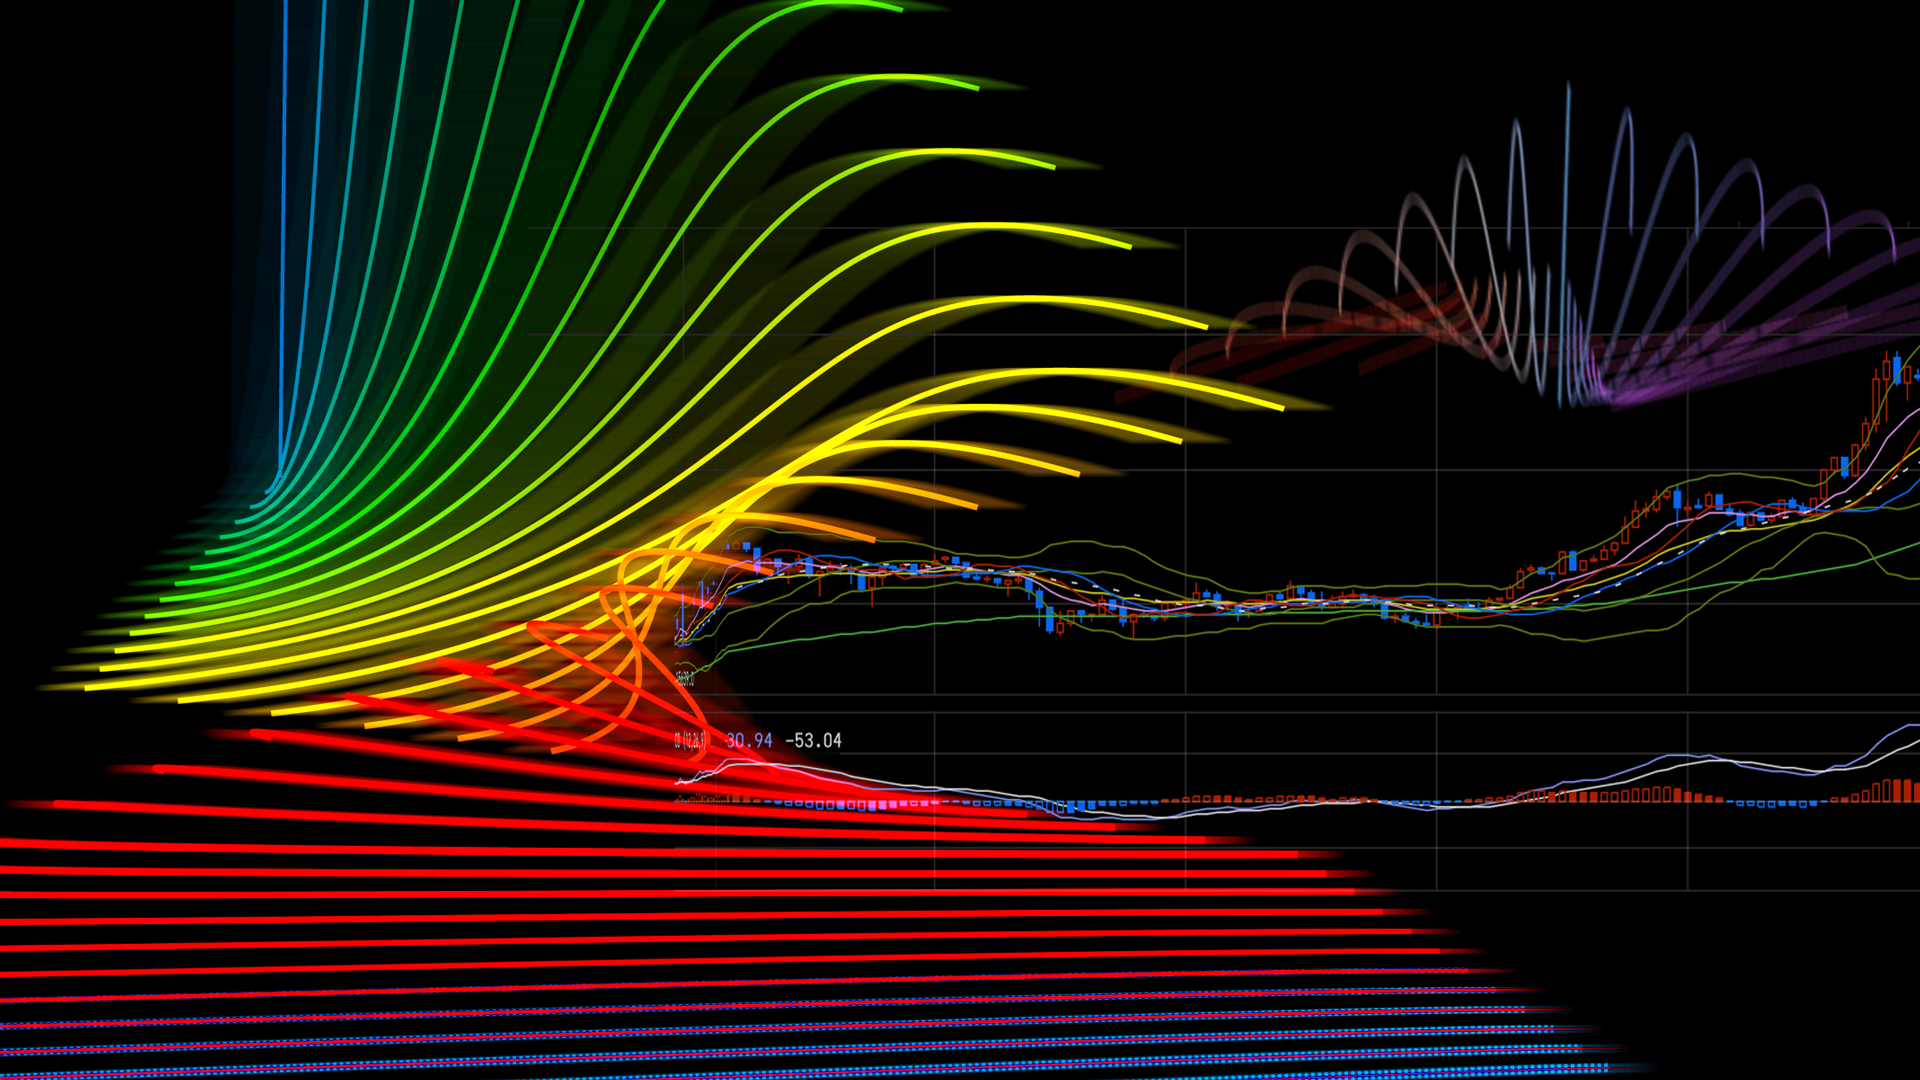
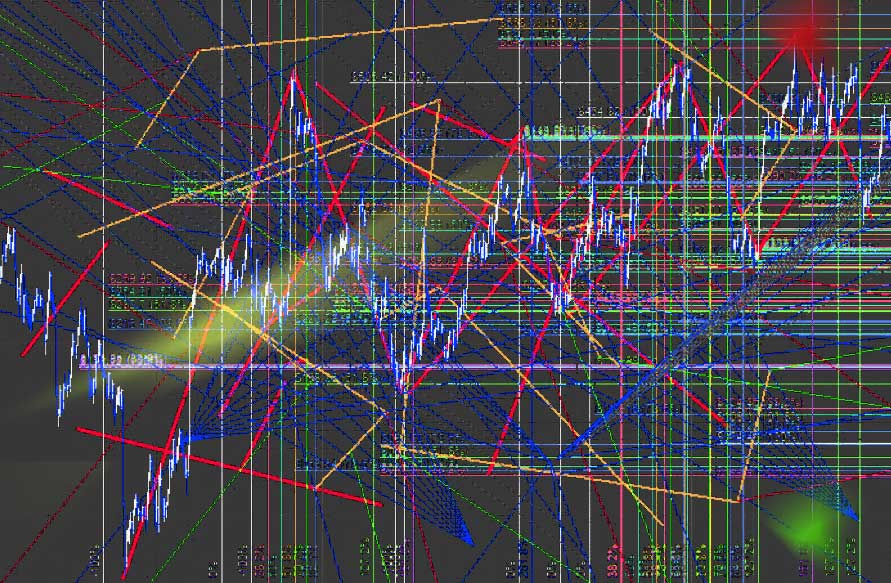
Installation accumulates historic and real-time trading data in local cache and uses provided calculations of trading trends (and indexes). Visualization and sonification modules utilize several specialized financial TA (Technical Analysis) programming libraries to dynamically calculate tension sections in audiovisual score.
Installation Experience
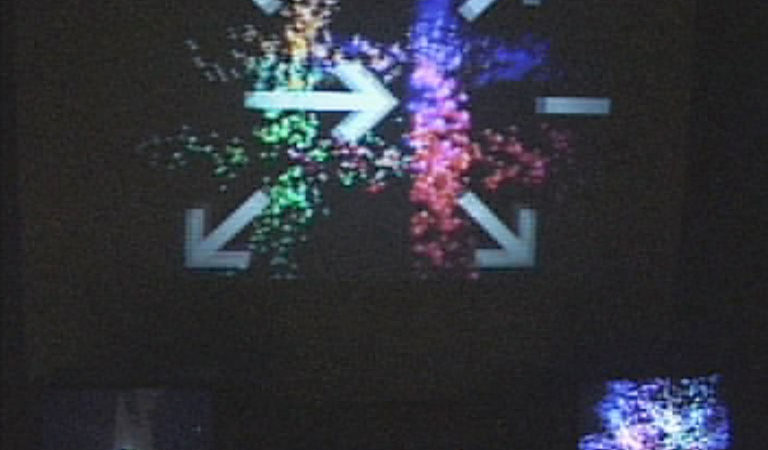
The imagery swings from abstracted pulsating grids to charts, models of traditional stock rate display in which several popular “technical analysis” patterns are “tried” on incoming (or replayed, historical) trade data. By options on touch screen and input devices, visitors can activate further display modes and levels of complexity. Various time zoom scales reveal the phases of historic trends or current trade execution. The system creates a dynamic feedback loop with the visitor’s perception effort of sense/making.